9 minutes
Zeek
Zeek Fundamentals
-
Zeek is an open-source network traffic analyzer used to detect suspicious or malicious activity by scrutinizing network traffic.
-
Beyond security, it aids in troubleshooting network issues and performing network measurements.
-
Once deployed, Zeek provides defensive cybersecurity teams with extensive log files detailing network activity, including connection records and application-layer transcripts (e.g., DNS, HTTP).
-
Zeek also offers built-in functions for analyzing and detecting network activities.
-
Zeek’s powerful scripting language allows users to create custom scripts, similar to Suricata rules, enabling adaptable network analysis and intrusion detection.
-
Unlike signature-based IDSs, Zeek’s script ability and ability to run on standard hardware facilitate:
- Semantic misuse detection.
- Anomaly detection.
- Behavioral analysis.
Zeek’s Operation Modes
- Zeek operates in the following modes.
Fully passive traffic analysis
- Zeek acts like a silent observer on a network tap or span port, meaning it monitors traffic without interfering with the flow of data.
- This ensures that even if Zeek experiences a failure, your network connectivity remains completely unaffected.
libpcap interface for packet capture
- Zeek uses the standard
libpcaplibrary to “listen” to the network interface, allowing it to capture raw data packets directly from the hardware. - It translates these messy, raw packets into high-level, readable logs that describe network events (like HTTP requests or TLS handshakes).
Real-time and offline (e.g., PCAP-based) analysis
- It can analyze live traffic as it happens to provide instant visibility, or it can ingest recorded PCAP files for forensic investigations.
- This allows security teams to “rewind the tape” and analyze past security incidents with the same depth as live events.
Cluster support for large-scale deployments
- To handle massive amounts of data (like a 100Gbps backbone), Zeek can be distributed across multiple servers in a cluster.
- A “manager” node coordinates the work, while multiple “worker” nodes split the traffic load, ensuring the system stays performant under heavy pressure.
Zeek’s Architecture
- Zeek’s architecture comprises two primary components:
- The
event engine(or core).- The
script interpreter.
- The
- The
Event Engine
-
Think of the Event Engine as a neutral translator.
-
It sits between:
- The raw, messy data of the network.
- The human-readable reports you actually want to see.
-
The Event Engine:
- Processes incoming network data.
- Then Converts it into meaningful events.
-
In Zeek, these events describe network activity without making any judgments or interpretations.
-
They simply tell us what is happening.
-
For example:
- An HTTP request is turned into an
http_requestevent. - This event includes all the details of the request but doesn’t analyze it or determine if it’s malicious, such as checking if a port is associated with malware.
- An HTTP request is turned into an
Script Interpreter
- Zeek’s script interpreter analyzes network traffic using event handlers written in the Zeek scripting language.
- These scripts implement the site’s security policy by defining actions to be taken upon detection of certain events.
- Zeek’s core queues events for processing in the order they are received.
- Most events are defined in
.biffiles within the/scripts/base/bif/plugins/ directory. - Refer to: https://docs.zeek.org/en/stable/scripts/base/bif/ for more information.
Zeek Logs
-
When Zeek analyzes a PCAP file offline, it saves logs to the current directory.
-
Common Zeek logs include:
conn.log—This log provides details about IP, TCP, UDP, and ICMP connections.dns.log—Here, you’ll find the details of DNS queries and responses.http.log—This log captures the details of HTTP requests and responses.ftp.log—Details of FTP requests and responses are logged here.smtp.log—This log covers SMTP transactions, such as sender and recipient details.
-
For example, the
http.logcontains valuable data such as:host—The HTTP domain/IP.uri—The HTTP URI.referrer—The referrer of the HTTP request.user_agent—The client’s user agent.status_code—The HTTP status code.
-
For a more exhaustive list of common Zeek logs and their respective fields, refer to the following resource: https://docs.zeek.org/en/master/logs/index.html
-
Zeek, by default:
- Compresses log files hourly using
gzip. - Archives them in
YYYY-MM-DDdirectories.
- Compresses log files hourly using
-
For working with these compressed logs, consider using tools like
gzcatorzgrep. -
You can find examples on how to work with gzip-compressed Zeek logs at this link: https://blog.rapid7.com/2016/06/02/working-with-bro-logs-queries-by-example/
-
While standard Unix commands like
catandgrepcan process Zeek logs, Zeek provides thezeek-cututility. -
This tool:
- Accepts Zeek log files as standard input via pipelines or stream redirection.
- Outputs specified columns.
-
If you’re interested in exploring Zeek examples, use cases, and learning the basics of writing Zeek scripts, take a look at the following link: https://docs.zeek.org/en/stable/examples/index.html
-
For a quick start guide to Zeek, refer to the following link: https://docs.zeek.org/en/stable/quickstart/index.html
Zeek Key Features
- Network activity logging.
- Application protocol analysis (HTTP, DNS, FTP, etc.).
- File content inspection.
- IPv6 support.
- Tunnel detection.
- Protocol sanity checks.
- IDS-like pattern matching.
- Powerful scripting for analysis and network state management.
- Structured ASCII logs with ElasticSearch/DataSeries backends.
- Real-time external input integration.
- External C library for Zeek events.
- External process triggering.
Intrusion Detection With Zeek
- Zeek, formerly Bro, is a powerful and flexible network security monitoring tool that provides deep insights into network traffic.
- Its rich logs and extensive scripting capabilities enable customized intrusion detection and continuous improvement of our security posture.
Intrusion Detection With Zeek Example 1: Detecting Beaconing Malware
-
Beaconing is a malware communication method/process where it periodically contacts its command and control (C2) server:
- To receive instructions.
- For data exfiltration.
-
Analyzing connection logs (
conn.log) for:- Repetitive connections to the same destination IP or domain.
- Constant data size.
- Connection timing.
-
This will look for patterns in outbound traffic, and reveal potential beaconing behavior.
/usr/local/zeek/bin/zeek -C -r /home/htb-student/pcaps/psempire.pcap
cat conn.log
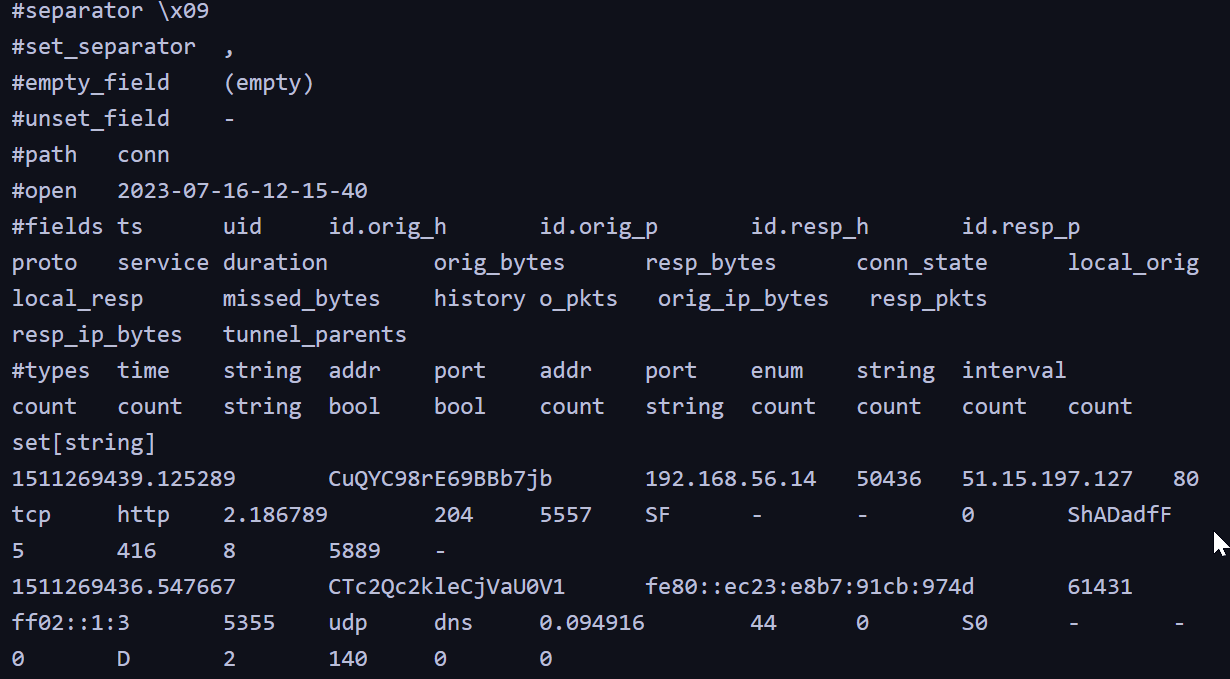
| Field | Value | What it means |
|---|---|---|
| ts | 1511269439.125289 |
The Timestamp: Exactly when the connection started (in Unix time). |
| uid | CuQYC98rE69BBb7jb |
Unique ID: A “tracking number” Zeek gives this specific conversation so you can find it in other logs (like the http.log). |
| id.orig_h | 192.168.56.14 |
Originator (Source): The IP address of the device that started the connection (the “caller”). |
| id.resp_h | 51.15.197.127 |
Responder (Destination): The IP address that answered the request (the “receiver”). |
| id.resp_p | 80 |
Port: They connected on Port 80, which is the standard port for unencrypted web traffic (HTTP). |
| proto | tcp |
Protocol: They used TCP, which is like a “certified mail” delivery system for data. |
| duration | 2.186789 |
Time Spent: The entire conversation lasted about 2.18 seconds. |
| orig_bytes | 204 |
Data Sent: The source device sent 204 bytes (likely a small web request). |
| resp_bytes | 5557 |
Data Received: The destination sent back 5,557 bytes (likely the actual webpage content). |
| conn_state | SF |
Status: “SF” stands for Synchronize and Finished. This means the connection started and ended perfectly with no errors. |
-
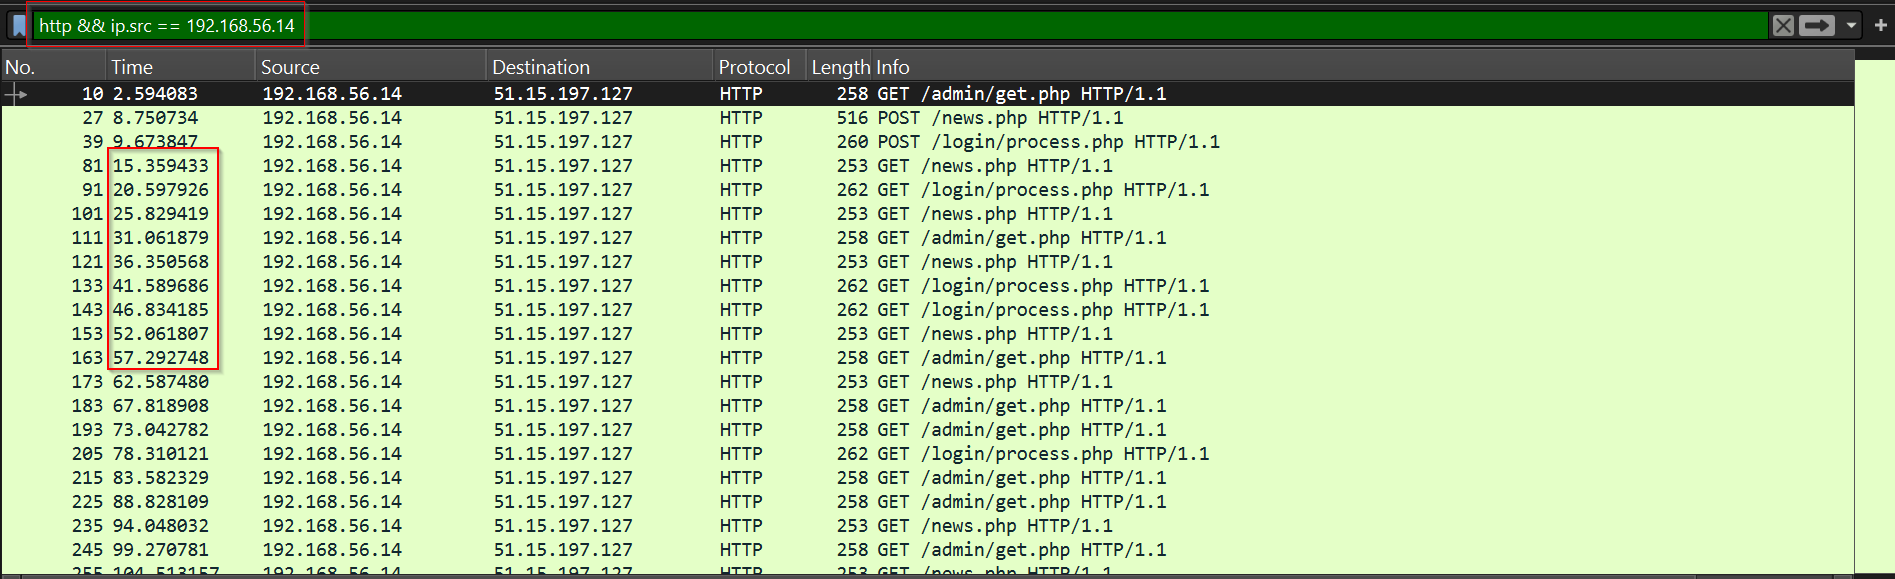
Traffic to
51.15.197.127:80occurs approximately every 5 seconds, suggesting malware beaconing. -
The
psempire.pcapfile contains traffic related to PowerShell Empire, which beacons every 5 seconds by default. -
Using this filter in Wireshark, will make the 5 seconds span more clear.
http && ip.src == 192.168.56.14
Intrusion Detection With Zeek Example 2: Detecting DNS Exfiltration
- Zeek aids in detecting data exfiltration, which is often difficult to identify due to its resemblance/mimicking to normal network traffic.
- Zeek’s deeper network traffic analysis allows for the identification of unusual data transfers. Specifically,
files.logcan reveal large data volumes sent to atypical external destinations or over non-standard ports. - The
http.loganddns.logcan expose covert (hidden or invisible) exfiltration channels like DNS tunneling or suspicious HTTP POST requests. - Additionally, Zeek’s file reassembly capability, irrespective of the protocol, helps determine the type/nature of exfiltrated data.
/usr/local/zeek/bin/zeek -C -r /home/htb-student/pcaps/dnsexfil.pcapng
- Let’s extract the requested (sub)domains using
zeek-cut.
cat dns.log | /usr/local/zeek/bin/zeek-cut query | cut -d . -f1-7
safebrowsing.google.com
456c54f2.blue.letsgohunt.online
456c54f2.blue.letsgohunt.online
wpad.windomain.local
456c54f2.blue.letsgohunt.online
www.180.0c9a5671.456c54f2.blue.letsgohunt.online
www.1204192da26d109d4.1c9a5671.456c54f2.blue.letsgohunt.online
www.11a1855b98d2b71c3.2c9a5671.456c54f2.blue.letsgohunt.online
www.1f5e94740470d0157.9c9a5671.456c54f2.blue.letsgohunt.online
www.114cbea690a81874a.ac9a5671.456c54f2.blue.letsgohunt.online
www.10db7634eade0b736.bc9a5671.456c54f2.blue.letsgohunt.online
www.1d5aee37e1c25ba02.cc9a5671.456c54f2.blue.letsgohunt.online
cdn.5600553f0.456c54f2.blue.letsgohunt.online
cdn.d600553f0.456c54f2.blue.letsgohunt.online
cdn.e600553f0.456c54f2.blue.letsgohunt.online
cdn.f600553f0.456c54f2.blue.letsgohunt.online
cdn.10600553f0.456c54f2.blue.letsgohunt.online
post.140.0346c53ab.456c54f2.blue.letsgohunt.online
post.10bb13b53.1346c53ab.456c54f2.blue.letsgohunt.online
post.104fb3984.2346c53ab.456c54f2.blue.letsgohunt.online
post.1bdfe1d1e.3346c53ab.456c54f2.blue.letsgohunt.online
post.19f3acfa6.4346c53ab.456c54f2.blue.letsgohunt.online
kohaqbopxlq.windomain.local
kohaqbopxlq.windomain.local
456c54f2.blue.letsgohunt.online
wpad.windomain.local
456c54f2.blue.letsgohunt.online
456c54f2.blue.letsgohunt.online
cdn.013821c34.456c54f2.blue.letsgohunt.online
cdn.b13821c34.456c54f2.blue.letsgohunt.online
cdn.c13821c34.456c54f2.blue.letsgohunt.online
456c54f2.blue.letsgohunt.online
456c54f2.blue.letsgohunt.online
456c54f2.blue.letsgohunt.online
456c54f2.blue.letsgohunt.online
post.1dbcb3f1b.37467121d5.456c54f2.blue.letsgohunt.online
---SNIP---
-
Command Explanation:
cat dns.log—This opens the Zeek DNS log file and feeds its raw text into the next part of the command.| /usr/local/zeek/bin/zeek-cut query—This uses Zeek’s specialized tool to isolate and extract only thequerycolumn while ignoring all other metadata like timestamps or IP addresses.| cut -d . -f1-7—This uses the period as a separator to keep only the first seven segments of each domain name, effectively stripping off any trailing data.
-
The domain
letsgohunt.onlinehas a high number of subdomains, similar to cloud providers. -
However, it’s worth noting that interactions with dozens or even hundreds of subdomains are generally not considered typical behavior.
Intrusion Detection With Zeek Example 3: Detecting TLS Exfiltration
- Let’s now go over an example of detecting data exfiltration over TLS.
/usr/local/zeek/bin/zeek -C -r <path-to-pcap-file>
-
Let’s narrow things down by using
zeek-cutone more time. -
One-liner source: activecountermeasures
cat conn.log | /usr/local/zeek/bin/zeek-cut id.orig_h id.resp_h orig_bytes | sort | grep -v -e '^$' | grep -v '-' | datamash -g 1,2 sum 3 | sort -k 3 -rn | head -10
10.0.10.100     192.168.151.181 270775912
10.0.10.100     10.0.10.1       0
-
cat conn.log—This command reads theconn.logfile, which Zeek generates to record network connections. -
/usr/local/zeek/bin/zeek-cut id.orig_h id.resp_h orig_bytes—we’re extracting the following fields:id.orig_h(originating host).id.resp_h(responding host).orig_bytes(number of bytes sent by the originating host).
-
sort—Sort arranges the output from the previous command, defaulting to ascending order based on the first field (id.orig_hin our case). -
grep -v -e '^$'—Filters out empty lines:-vinverts the selection (it will show you everything except empty lines).-eenables regular expression matching, and^$matches empty lines.
-
grep -v '-'—This command filters lines containing a dash (-), which in Zeek logs typically indicates a missing value or undefined field. -
datamash -g 1,2 sum 3—datamashis a command-line tool for numeric, textual, and statistical operations. The option-g 1,2 sum 3groups the output by the first two fields (originating and responding host IP addresses) and calculates the sum of the third field (bytes sent) for each group. -
sort -k 3 -rn—Sorts the output by the numerical value of the third field (sum oforig_bytesfor each IP address pair) (-k 3) in descending order (-rn). -
head -10—This command displays the top 10 IP address pairs ranked by total bytes sent from originating to responding host. -
Approximately
270 MBof data was sent to192.168.151.181.
Intrusion Detection With Zeek Example 4: Detecting PsExec
-
PsExec, a Sysinternals tool, is commonly used for remote administration in Active Directory environments, but its powerful capabilities also make it a favorite preference of adversaries for remote code execution attacks.
-
To illustrate a typical attack sequence, let’s consider this:
- An attacker transfers the binary file
PSEXESVC.exeto a target machine using theADMIN$share, a special shared folder used in Windows networks, via the SMB (Server Message Block) protocol. - Following this, the attacker remotely launches this file as a temporary service by utilizing the
IPC$share, another special shared resource that enables Inter-Process Communication.
- An attacker transfers the binary file
-
We can identify SMB transfers and the typical use of
PsExecusing Zeek’ssmb_files.log,dce_rpc.log, andsmb_mapping.log.