Network Traffic Analysis
Network Traffic Analysis
-
Network Traffic Analysis (NTA)can be described as the act of examining network traffic to:- Characterize common ports and protocols utilized.
- Establish a baseline for our environment.
- Monitor and respond to threats.
- Ensure the greatest possible insight into our organization’s network.
-
Network Traffic Analysis (NTA) enables security specialists to quickly identify network anomalies and security threats, facilitating compliance with security guidelines.
-
Attackers constantly evolve their tactics to evade detection, leverage legitimate credentials with tools that most companies allow in their networks, making detection and, subsequently, response challenging for defenders.
-
NTA can be invaluable in these scenarios.
-
Everyday use cases of NTA include:
Collecting real-time traffic within the network to analyze upcoming threats. |
|---|
Setting a baseline for day-to-day network communications. |
Identifying and analyzing traffic from non-standard ports, suspicious hosts, and issues with networking protocols such as HTTP errors, problems with TCP, or other networking misconfigurations. |
Detecting malware on the wire, such as ransomware, exploits, and non-standard interactions. |
| NTA is also useful when investigating past incidents and during threat hunting. |
-
Imagine an threat actor targeting and infiltrating our network.
-
To succeed, they must interact with our systems/communicate with our infrastructure.
-
Our network uses many different communication methods (ports and protocols) at the same time, used by employees, devices, and customers.
-
To find malicious activity, we need to understand what normal network traffic looks like.
-
This will help us focus our search and quickly stop the attacker’s communication.
-
For example:
- If we detect many
SYNpackets on ports that we never (or rarely) utilize in our network. - We can conclude that someone is trying scan open ports on our hosts.
- These actions are indicators of
portscan.
- If we detect many
-
Performing such an analysis and coming to such conclusions requires specific skills and knowledge.
Environment and Equipment
- Some Tools and Equipment exist to perform network traffic analysis
- They capture or dissect/analyze traffic, but in different ways.
- Some copy and record data, while others read and process it.
- Tools like this can be used for both purposes, either Administration or malicious purpose.
Common Traffic Analysis Tools
| Tool | Description |
|---|---|
tcpdump |
tcpdump is a command-line utility that, with the aid of LibPcap, captures and interprets network traffic from a network interface or capture file. |
Tshark |
TShark is a network packet analyzer much like TCPDump. It will capture packets from a live network or read and decode from a file. It is the command-line variant of Wireshark. |
Wireshark |
Wireshark is a graphical network traffic analyzer. It captures and decodes frames off the wire and allows for an in-depth look into the environment. It can run many different dissectors against the traffic to characterize the protocols and applications and provide insight into what is happening. |
NGrep |
NGrep is a pattern-matching tool built to serve a similar function as grep for Linux distributions. The big difference is that it works with network traffic packets. NGrep understands how to read live traffic or traffic from a PCAP file and utilize regex expressions and BPF syntax. This tool shines best when used to debug traffic from protocols like HTTP and FTP. |
tcpick |
tcpick is a command-line packet sniffer that specializes in tracking and reassembling TCP streams. The functionality to read a stream and reassemble it back to a file with tcpick is excellent. |
Network Taps |
Taps (Gigamon, Niagra-taps) are devices capable of taking copies of network traffic and sending them to another place for analysis. These can be in-line or out of band. They can actively capture and analyze the traffic directly or passively by putting the original packet back on the wire as if nothing had changed. |
Networking Span Ports |
Span Ports are a way to copy frames from layer two or three networking devices during egress or ingress processing and send them to a collection point. Often a port is mirrored to send those copies to a log server. |
Elastic Stack |
The Elastic Stack is a culmination of tools that can take data from many sources, ingest the data, and visualize it, to enable searching and analysis of it. |
SIEMS |
SIEMS (such as Splunk) are a central point in which data is analyzed and visualized. Alerting, forensic analysis, and day-to-day checks against the traffic are all use cases for a SIEM. |
| and others. |
BPF Syntax
- Most of these tools share a common syntax: Berkeley Packet Filter (BPF) syntax.
- BPF:
- Is a technology that provides a raw interface for reading and writing data at the Data-Link layer.
- It allows us to filter and decode data.
- Therefore, understanding the basics of BPF filter setup will be useful.
- For more details on BPF syntax, refer to this reference.
Performing Network Traffic Analysis
-
Analyzing network activity can be:
- Straightforward/Simple, like observing real-time traffic in our console.
- Or Complex, like capturing data with a tap, sending it to a SIEM for analysis, and examining the pcap data for patterns and alerts related to common attack methods.
-
We must be connected to the network segment to passively monitor traffic we want to observe.
-
This is particularly important in switched networks, where VLANs and switch ports don’t forward traffic outside their broadcast domain.
-
Therefore, if we want to capture traffic from a specific VLAN, our monitoring device needs to be connected to that same network.
-
Network taps, switch or router configurations like span ports, and port mirroring allow us to obtain a copy of all traffic passing through a specific link, regardless of its network segment or destination.
NTA Workflow
- Traffic analysis is not an exact science.
- NTA can be a very dynamic process and is not a direct loop.
- It is greatly influenced by:
- What we are looking for (network errors vs. malicious actions).
- Where we have visibility into our network.
NTA Workflow
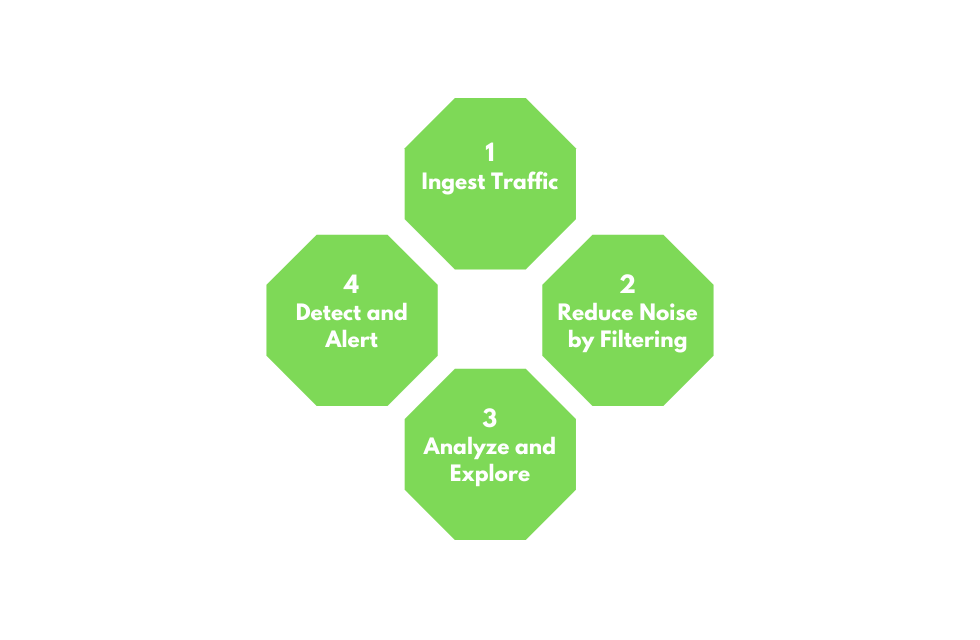
1. Ingest Traffic
- Once we have decided on our placement, begin capturing traffic.
- Utilize capture filters if we already have an idea of what we are looking for.
2. Reduce Noise by Filtering
- Capturing traffic of a link, especially one in a production environment, can be extremely noisy.
- Once we complete the initial capture, an attempt to filter out unnecessary traffic from our view can make analysis easier. (Broadcast and Multicast traffic, for example.)
3. Analyze and Explore
- In this step we start to extract traffic relevant to the problem we’re trying to solve.
- Look at specific hosts, protocols, even things as specific as flags set in the TCP header.
- The following questions will help us:
- Is the traffic encrypted or plain text? Should it be?
- Can we see users attempting to access resources to which they should not have access?
- Are different hosts talking to each other that typically do not?
4. Detect and Alert
- Are we seeing any errors? Is a device not responding that should be?
- Use our analysis to decide if what we see is benign or potentially malicious.
- Tools like IDS and IPS can come into play. They can run heuristics and signatures against the traffic to determine if anything within is potentially malicious.
5. Fix and Monitor
- Fix and monitor is not a part of the loop but should be included in any workflow we perform.
- If we make a change or fix an issue, we should continue to monitor the source for a time to determine if the issue has been resolved.
Networking Primer - Layers 1-4
- The following concepts are at the core of capturing and dissecting/analyzing traffic.
- Without a fundamental understanding of typical network flow and what ports and protocols are used, we cannot accurately analyze any traffic we capture.
OSI / TCP-IP Models
Networking Models
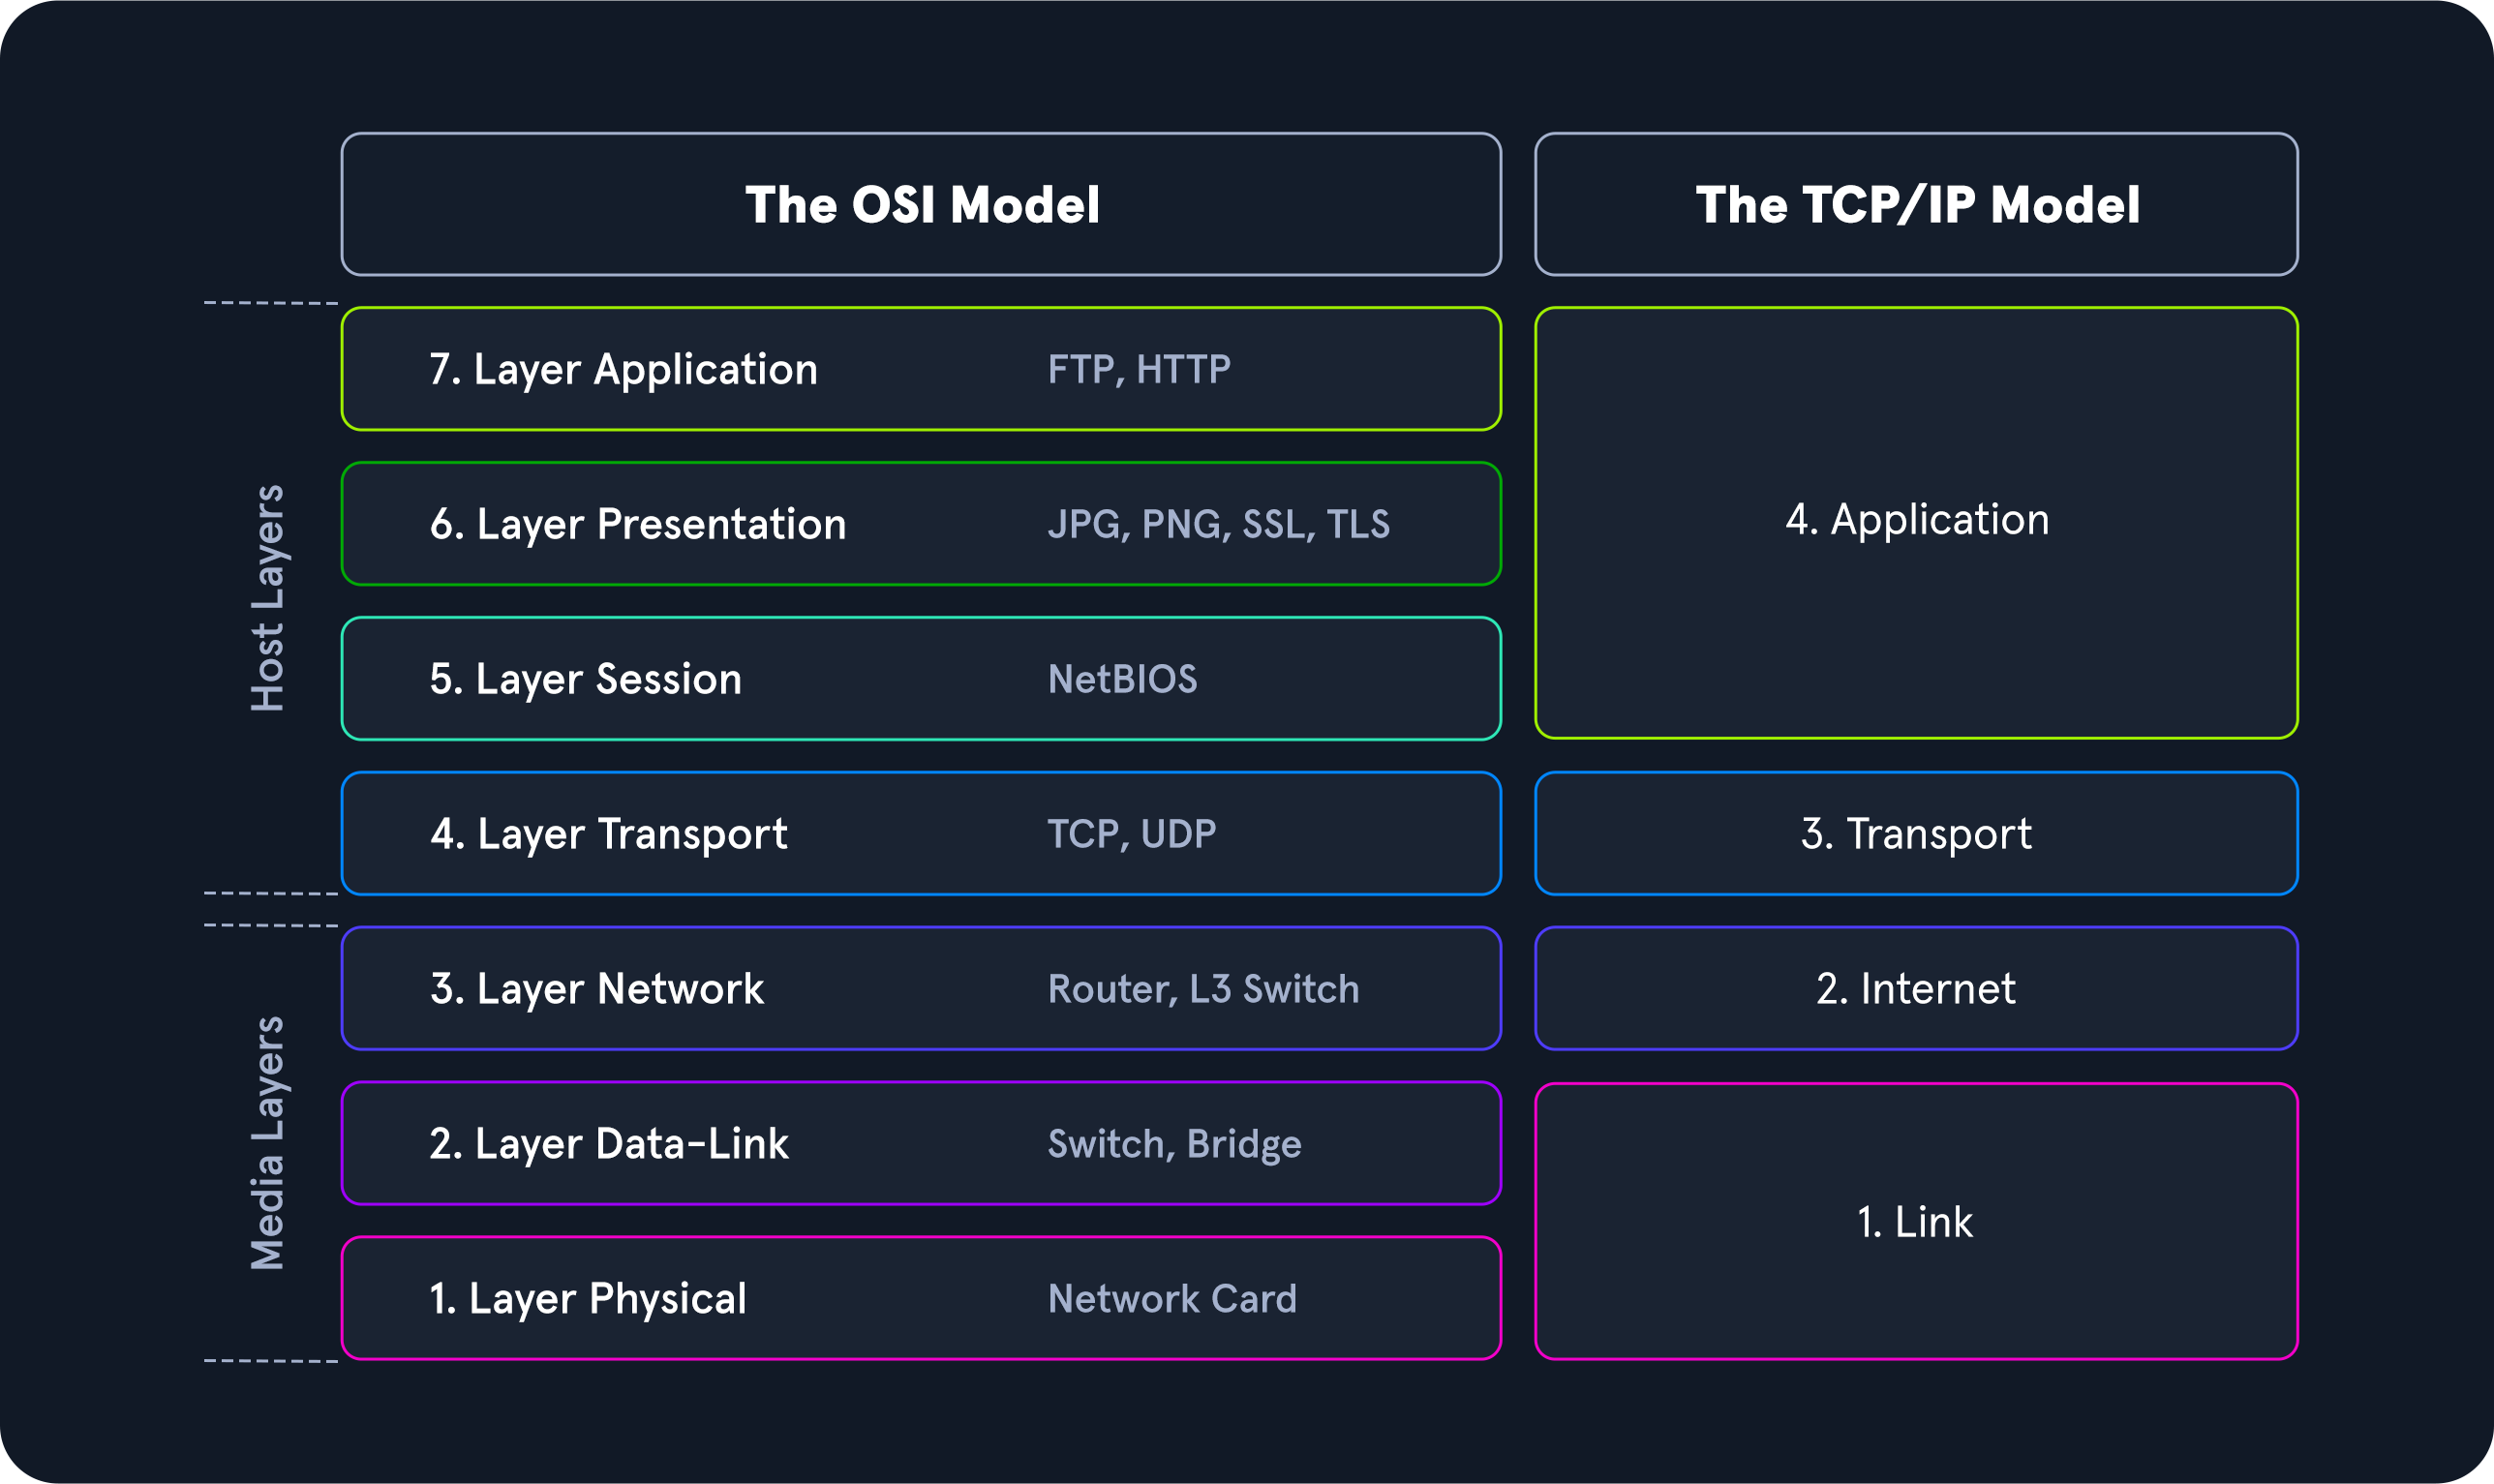
- The image shows a side-by-side comparison of OSI & TCP/IP Models.
- These models visually represent how networked computers communicate.
Model Traits Comparison.
| Trait | OSI | TCP-IP |
|---|---|---|
| Layers | Seven | Four |
| Flexibility | Strict | Loose |
| Dependency | Protocol independent & generic | Based on common communication protocols |
-
The OSI model is more segmented than the TCP/IP model, breaking functionality into smaller chunks, and usually used for troubleshooting.
-
The OSI model’s:
- Layers 1 through 4 manage data transport between hosts, encompassing the physical medium and communication protocols.
- Layers 5 through 7 handle data interpretation, management, and presentation for the end-user.
-
The OSI model represents a theoretical framework, while the TCP/IP model more closely reflects practical networking.
-
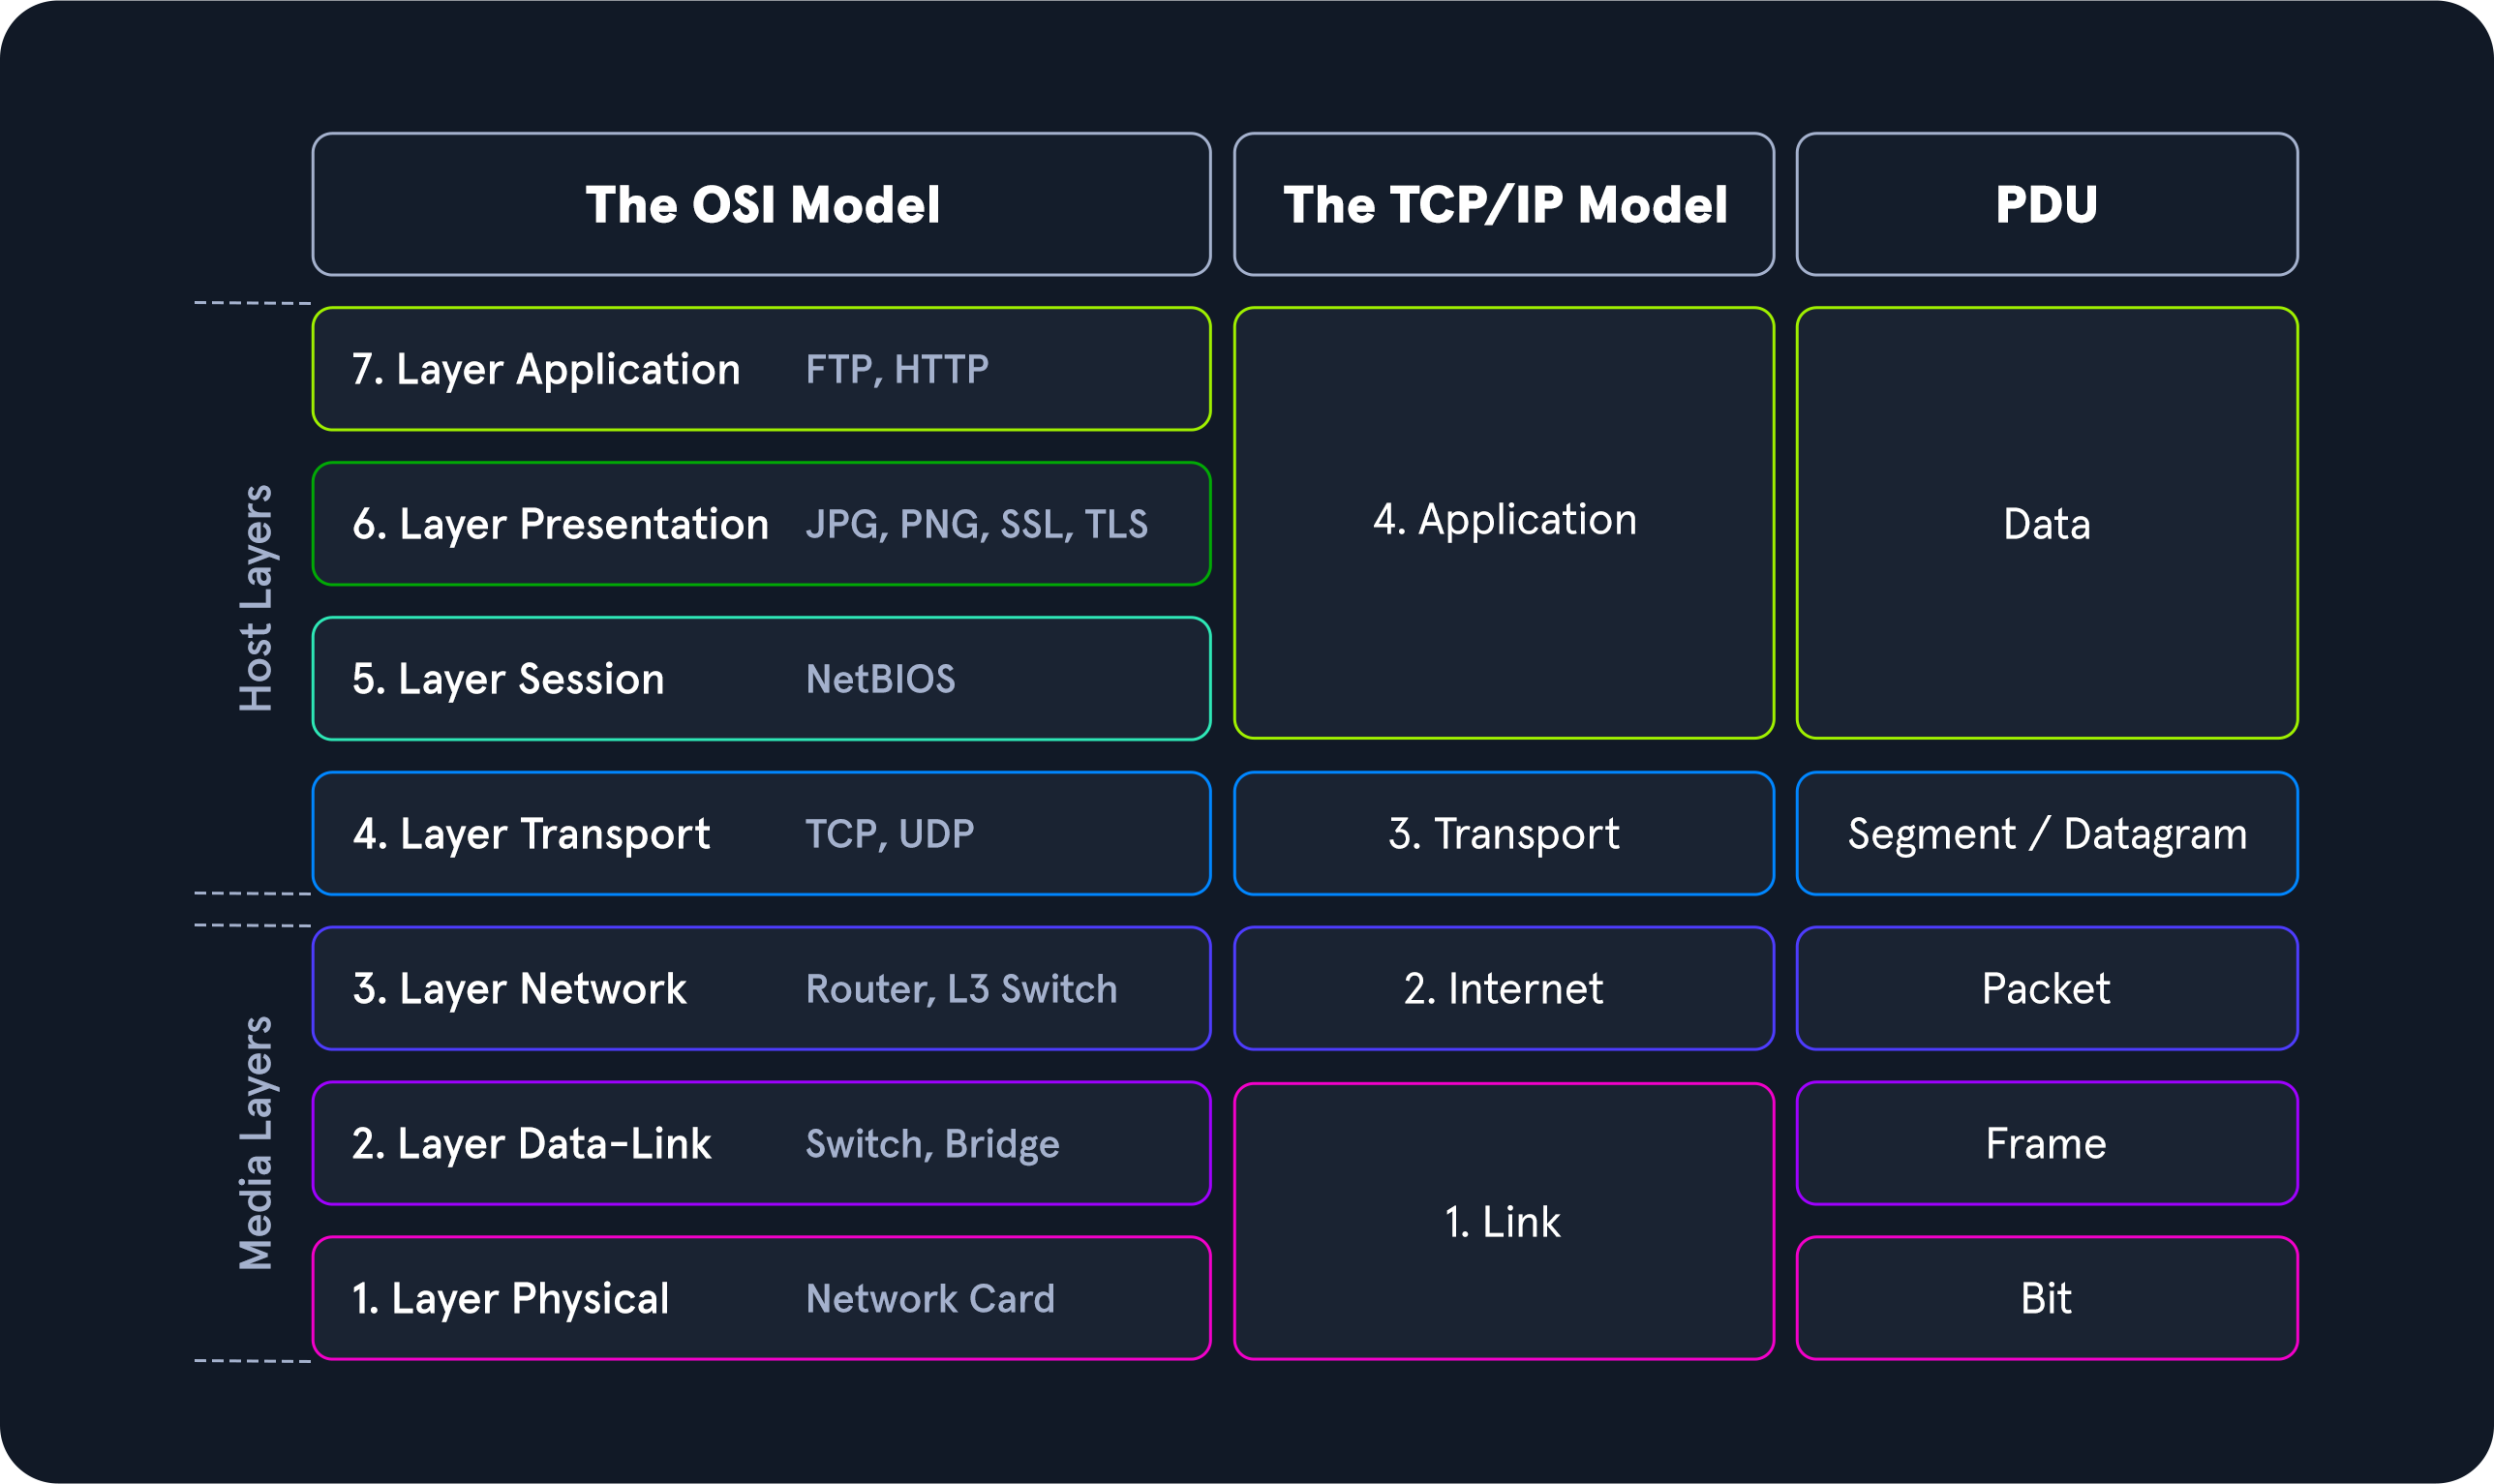
It’s important to understand how a Protocol Data Units (PDU) is structured, both in theory and as it appears when transmitted.
-
A PDU is a data packet made up of:
- Control Information.
- Data encapsulated from each layer of the OSI model.
-
The breakout below will show how the layers in the two models match up to a PDU.
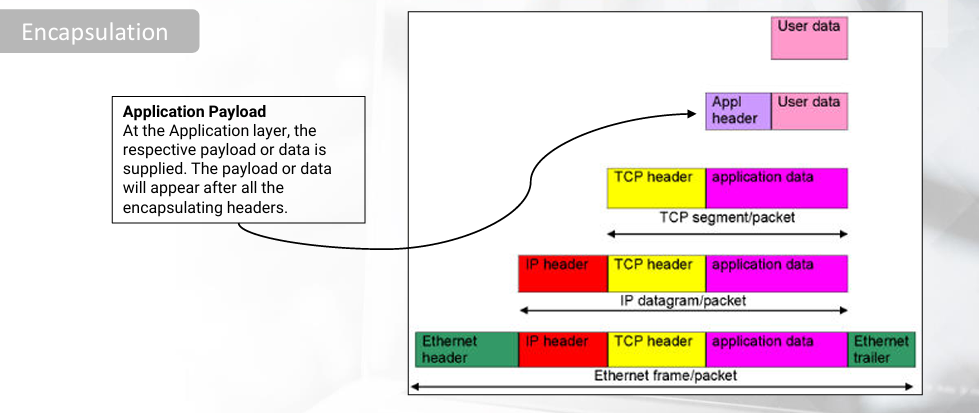
Encapsulation
-
When examining a Protocol Data Unit (PDU), remember the concept of encapsulation.
-
As data moves down the protocol stack, each layer adds a header to the data from the previous layer, like wrapping it in a bubble.
-
This process is called encapsulation.
-
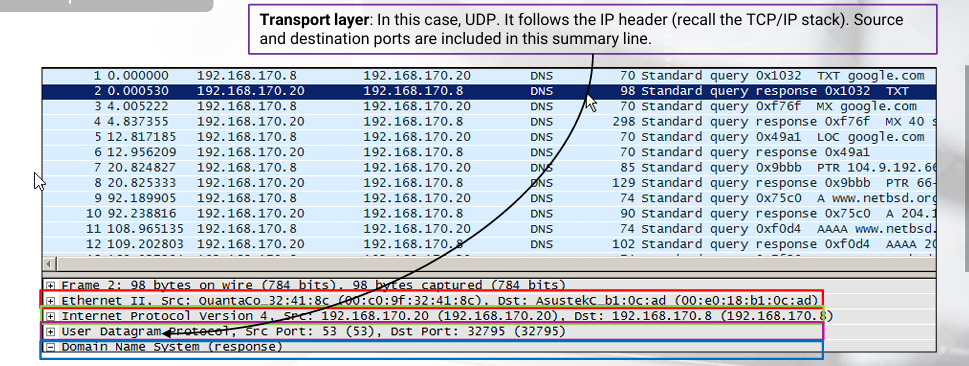
The header contains information specific to that layer, such as the data from the previous layer, operational flags, communication options, source and destination IP addresses, ports, and transport and application layer protocols.
-
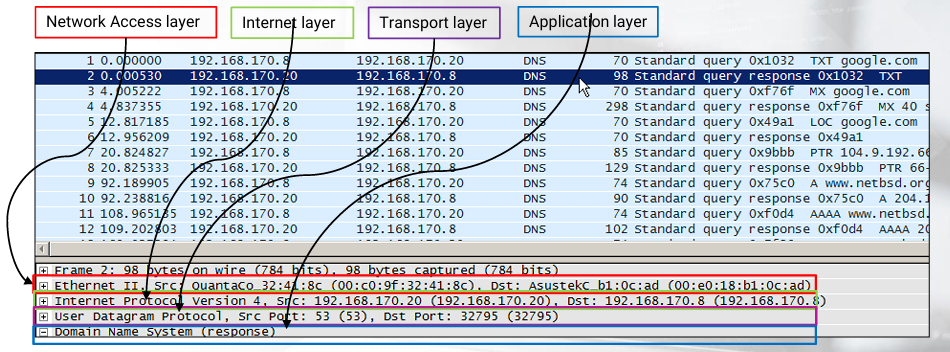
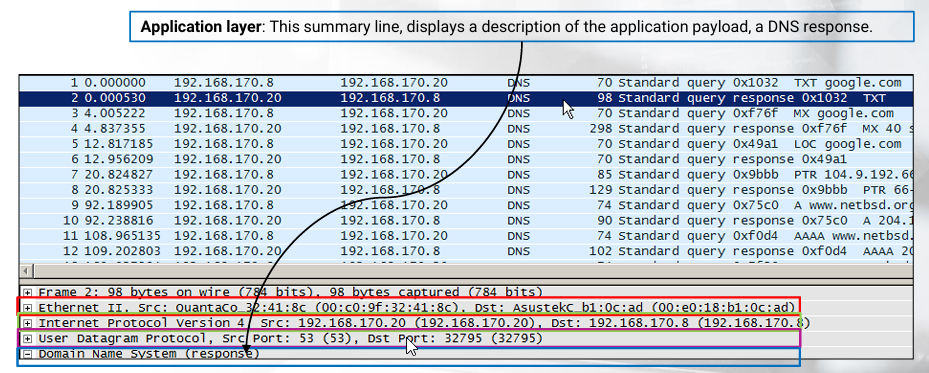
Traffic analysis tools, such as Wireshark • Go Deep , display data encapsulation.
-
Just be careful in Wireshark’s case, because the layers are displayed in reverse order (the lower layers are displayed first).
-
For example, let’s see how a DNS response looks like in Wireshark, accompanied by encapsulation details.
-
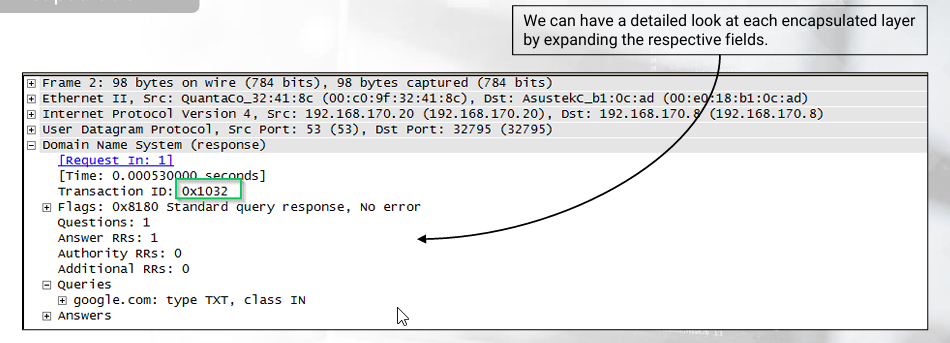
What is important to understand, is that what we see in Wireshark is Wireshark’s interpretation.
-
As you can imagine, there is margin for error.
-
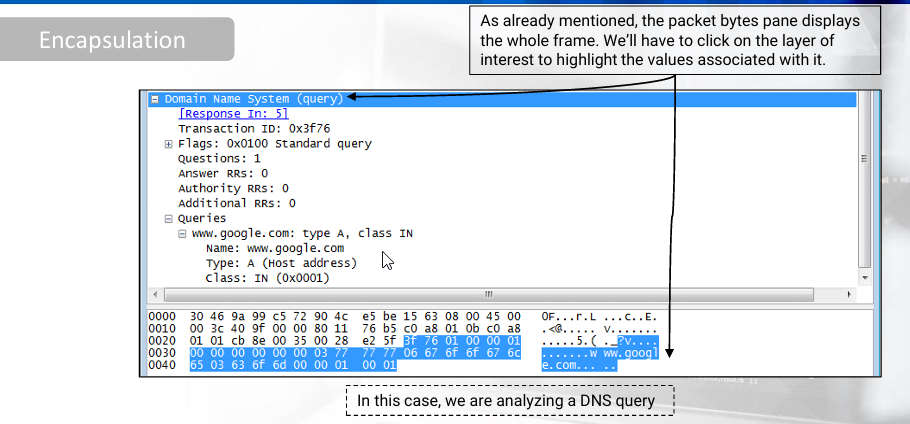
Hopefully, Wireshark and other tools feature packet bytes panes (displaying the whole frame).
-
By taking the displayed hexadecimal values in those panes and interpreting them ourselves, we can be 100% certain of the interpretation result.
PDU Packet Breakdown
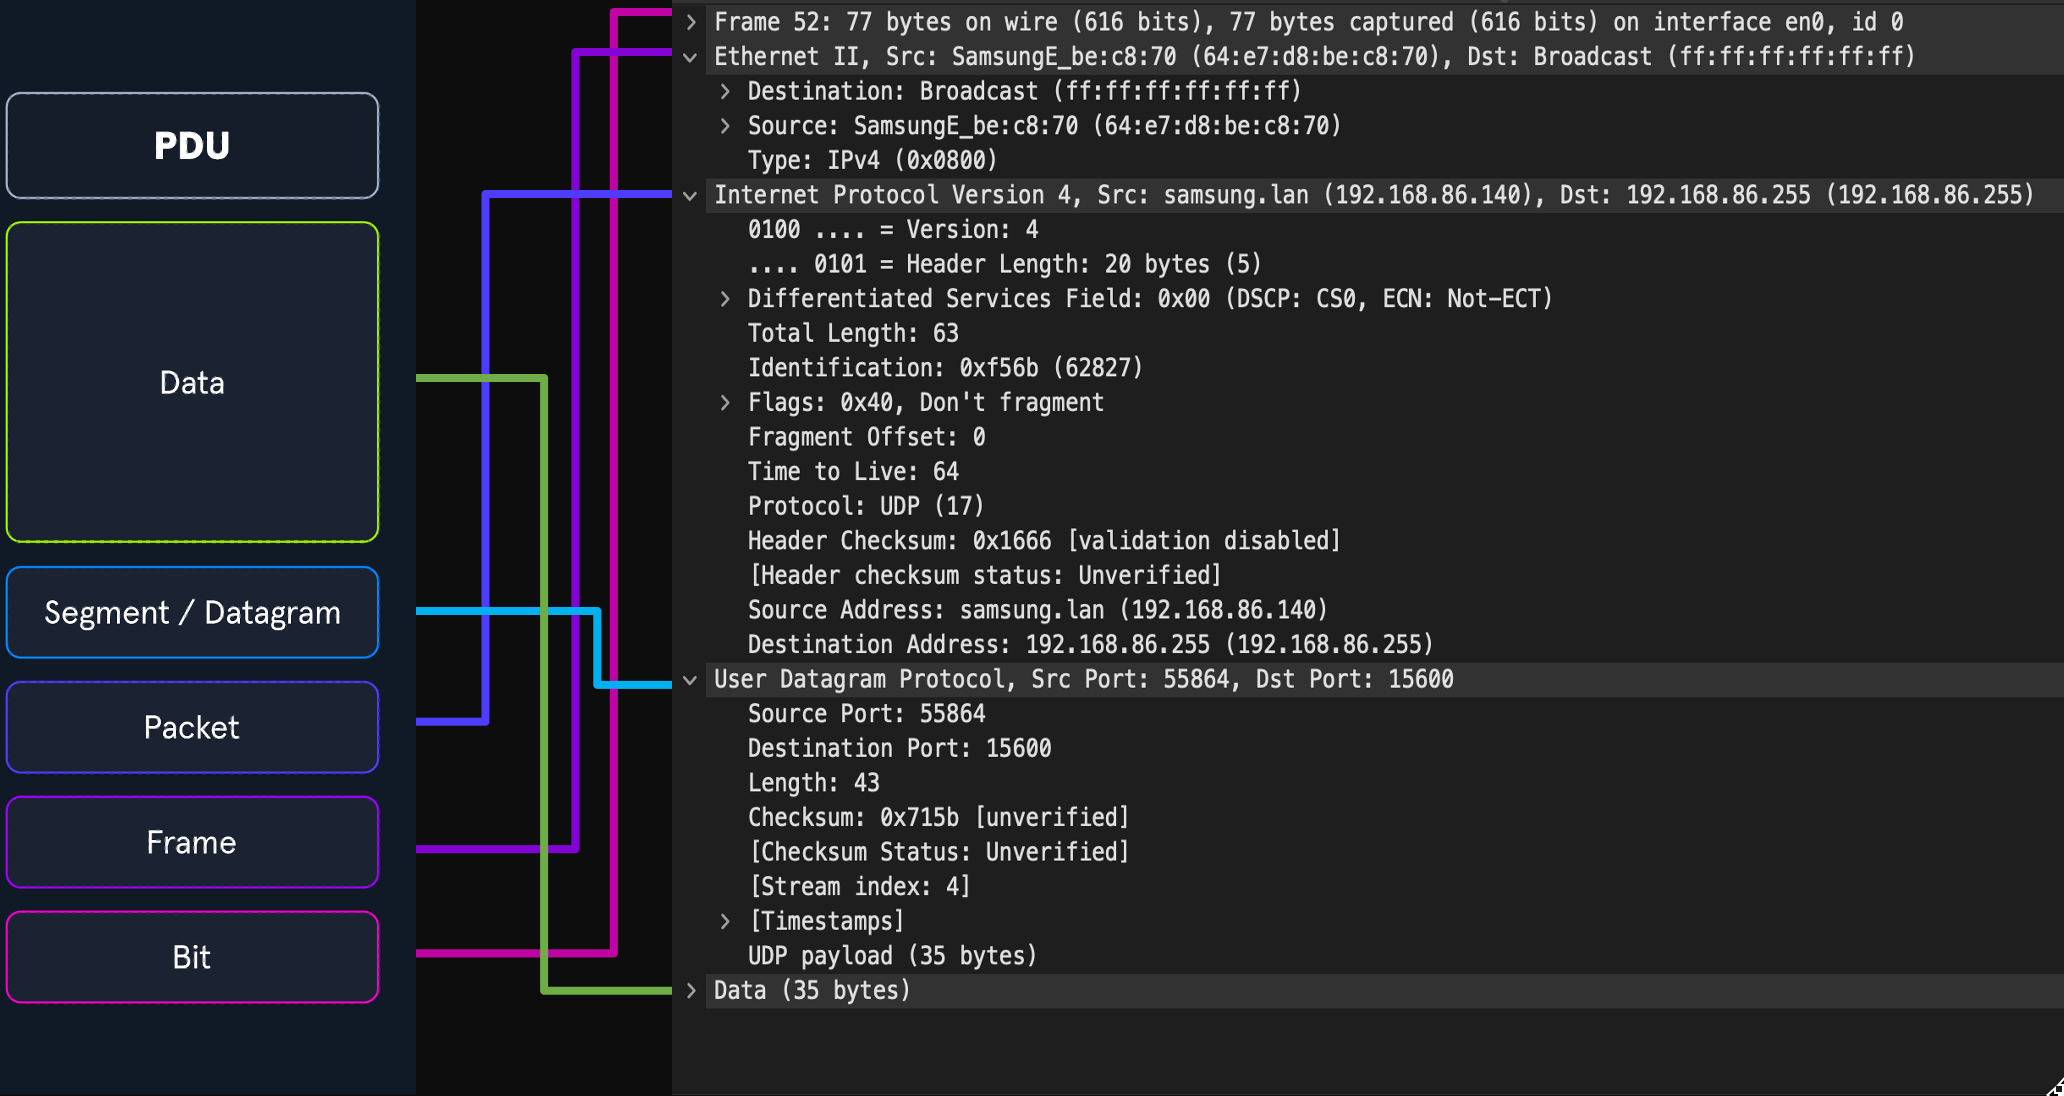
- The image above shows us the makeup of a PDU side by side with a packet breakout from Wireshark’s Packet Details pane.
- Wireshark shows us the PDU in reverse because it is in the order that it was de-encapsulated.
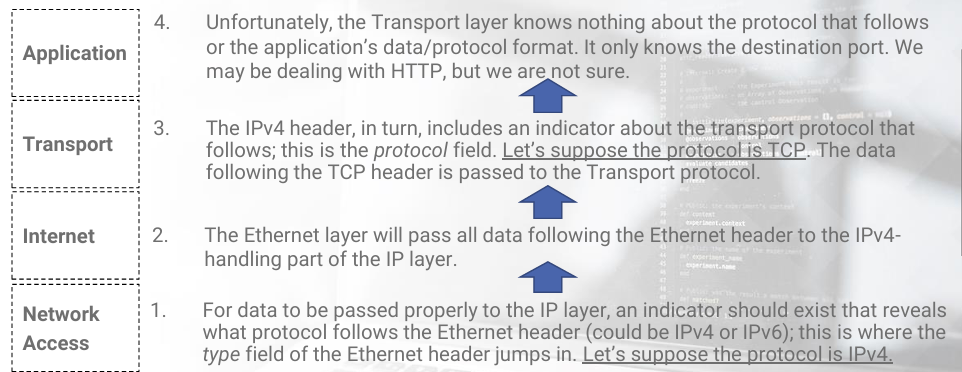
De-encapsulation
-
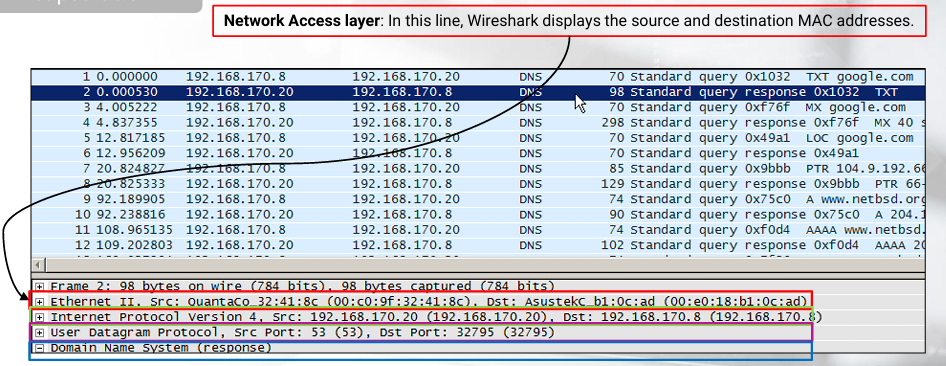
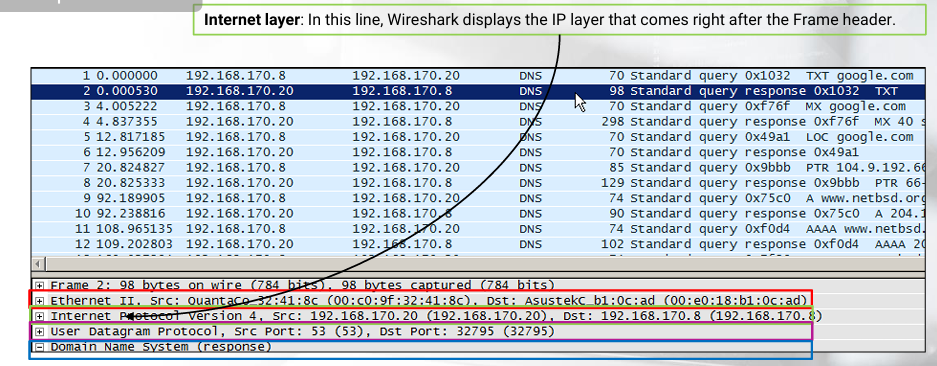
For example, the Network Access layer will:
- Receive the frame.
- Analyze the data.
- Strip the frame header off.
- Finally, pass the IP header and accompanying data to the Internet layer.
-
Each layer deals only with the data that are meant to be handled by it.
-
Most of the time, a protocol identifier exists which can be found in the previous layer.
-
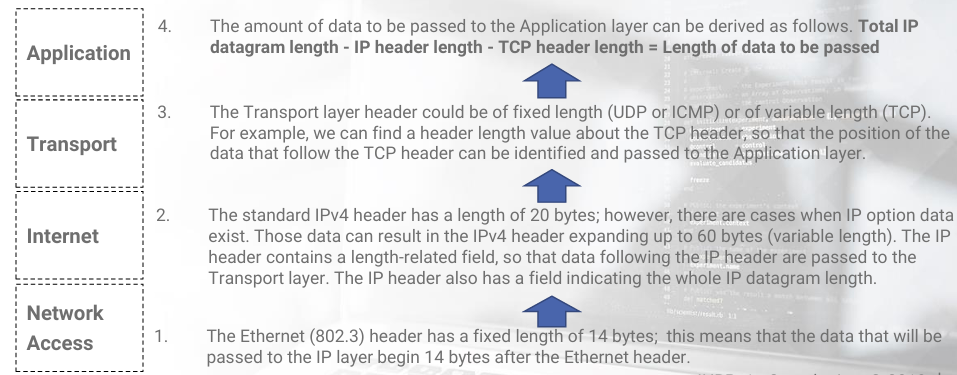
It should be noted:
- That some layer headers are of fixed size.
- While others are of variable length size and are accompanied by length details (this is useful to discriminate optional data or know where a layer ends).
-
Based on this knowledge, each current layer knows:
- Where to start and stop processing data.
- And subsequently what it should pass to the upper layer.
-
To conclude the topic of how each layer knows what to process, option fields also exist, residing in IP and TCP headers, that are used to identify where current layer options start and end.
-
Let’s briefly see a frame de-encapsulation example.
-
Let’s suppose a network access card supports the Ethernet (802.3) link layer protocol.
-
This means that the card understands the format and all the fields in the frame header.
-
Same example, but a little deeper…
RFC
-
Knowing how normal traffic looks like is of great importance.
-
Then, and only then, you will be able to spot abnormalities when analyzing traffic.
-
For this matter, Request For Comments (RFC) is an invaluable resource.
-
RFC are documents that strictly describe the expected standards for a particular protocol.
-
For example, RFC 793 –Transmission Control Protocol describes TCP functionality and implementation details as well as the interface using which TCP services are requested.
-
However, RFC documents can sometimes be unclear or incomplete.
-
As an analyst, you will have to combine RFC with environment context in order to conclude if something poses as a threat or not.
Intermediate Network Traffic Analysis
Intermediate Network Traffic Analysis Overview
-
In today’s fast-paced and complex network environments, understanding/mastering network traffic analysis is crucial.
-
The sheer amount (كمية هائلة) of traffic flowing through our networks can be overwhelming, making us feel unprepared. This is a challenge we must address/overcome.
-
A wide range of attacks targeting crucial components of network infrastructure, will be covered.
-
Attacks on the link, IP, transport, network, and application layers will be covered as well.
-
Our aim is to identify patterns in these attacks so we can effectively detect and respond to these threats in an efficacious manner..
-
Additional skills to augment our abilities (تعزيز قدراتنا) will be discussed.
-
We will touch upon:
- Anomaly detection techniques.
- Delve into facets of log analysis (تعمّق في جوانب تحليل السجلات).
- Investigate some Indicators of Compromise (IOCs).
-
This comprehensive approach improves both:
- Proactive threat identification (how we find threats before they happen).
- Enhances our reactive measures (how we handle them when they do).
-
Which will empower us to identify, report, and respond to threats more effectively and within a shorter time frame.